Post-Concussion Athlete Comprehensive Evaluation (PACE)
Statement of Individual Contribution
This project was a group effort of 3 dedicated team members (including me). My primary responsibilities were writing, testing, and validated the computer vision part of the project. This included the preliminary research, writing and testing Python code, and planning future motion capture studies based on result analysis of prior studies. I also contributed to the web application by writing the Flask API hosted on AWS, literature research, report writing, and presentations.
TLDR
Concussions, defined as a form of brain injury caused by a jolt or knock to the head, occur frequently and at a startling magnitude in full-contact varsity sports, with Waterloo Men’s Rugby B team, for example, seeing 1-2 concussions per game [1]. Current on-field diagnostic solutions (the SCAT5 test) are heavily subjective, making it difficult for the therapist to make the best decision for the athlete. PACE (Post-Concussion Athlete Comprehensive Evaluation) aims to analyze an athlete’s gait cycle on the field of play in order to provide the athletic therapist with objective data to support their decision. Using computer vision technologies, PACE can use a video of an athlete walking to determine the athlete’s stride length, gait velocity, and medial-lateral sway; collecting this data at the beginning of the athlete’s season and again upon possible injury allows PACE to detect deviations from an athlete’s baseline walking pattern and neurocognitive function to facilitate more informed on-field decision-making processes.
1. Introduction
A traumatic brain injury (TBI), more commonly referred to as a concussion, is a form of brain injury that is usually a result of a jolt or blow to the head that impacts the function of the brain [2]. Student-athletes are amongst the most vulnerable population to concussions, with an estimated 11,000 sports-related concussions (SRCs) per year occurring among student-athletes in the National Collegiate Athletic Association (NCAA), which regulates all student-athletes in the United States of America [3]. It is expected that the incidence rate of sports-related concussions is even higher than this estimated value; anywhere between 50-85% of SRCs are believed to go undetected and undiagnosed [4]. The consequences of undiagnosed concussions can drastically vary. While some consequences are minor, some are incredibly severe; an undetected concussion can result in second-impact syndrome, defined as a second head injury that occurs soon after the previous undetected concussion [5]. This can lead to brain herniation, cerebral swelling, and in worst-case scenarios, death [5]. Diagnosing concussions as soon as they occur is imperative to an athlete’s health, but concussion diagnosis is unfortunately not simple. On-field concussion detection is currently limited to a subjective test known as the SCAT5, which is heavily reliant on subjectivity and the assumption that the athlete will be completely honest [6]. Due to what is known as a popular ‘risk culture’ in sports, the willingness of the athlete to ‘risk it for the game’ is said to be a driving force behind concussion non-disclosure in the NCAA; thus, the athlete may not be inclined to answer truthfully [7].
The need for more objective concussion detection protocols has led to several technological developments in the industry. However, many of the proposed solutions are designed for clinical use and not suitable for on-field detection. For example, Neurolytix Inc has developed a blood diagnostic tool that can use a small blood sample to detect a concussion within 20 minutes, but this process requires a lab for testing [8]. This requires lab availability within range of the injury as well as safe and efficient transport and handling. BrainScope has developed a non-invasive headset that uses Electroencephalography (EEG) signals to detect the probability of a brain hemorrhage or TBI in under 20 minutes [9] [10]. However, its intent is to replace CT scans rather than accurately detect concussions of varying severity; the device is more effective in detecting TBIs of high severity and not concussions of differing degrees of intensity.
2. Project Motivation
Due to the sheer frequency of TBIs and the difficulty of diagnosis on-field, the project’s aim is to provide objective data to an athletic therapist to aid them in making their diagnosis and mitigate the need to make decisions based on purely subjective data. To avoid the aforementioned ‘risk culture’ in sports, the therapists will be provided with a method of collecting objective data from the athlete’s gait cycle that will assist them in appropriately assessing the athlete’s state. This project will be intended for sports with the highest volume of concussions (full-contact sports), but has the potential to be expanded to a wide variety of sports and activities in the future. The project aims to be accurate, easy to use, and timely. Thus, the situation impact statement reads as follows: “design a solution to be used by athletic therapists on-field to aid in concussion assessment in post-secondary varsity athletes in full-contact sports in an objective and timely manner.”
3. Engineering Analysis and Design Methods
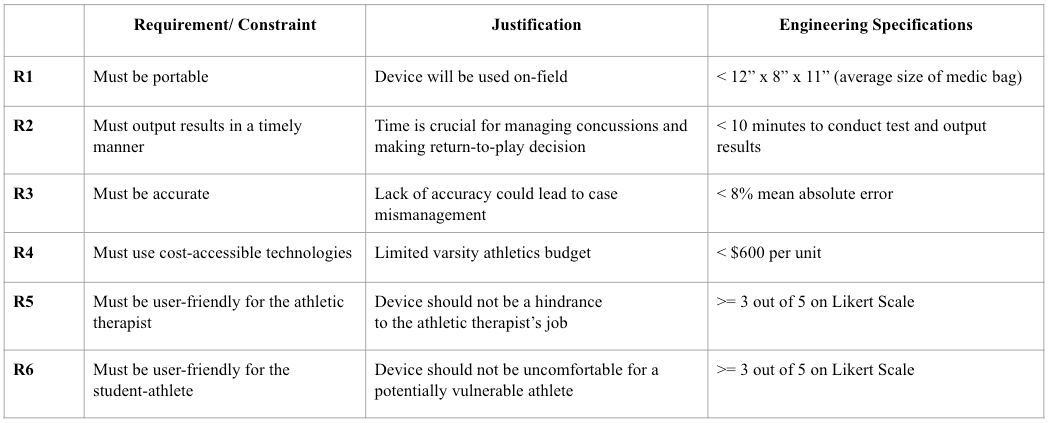
Several ideas for detecting concussions were discussed, but ultimately, the idea that showed the most promise was gait analysis. Research studies show that gait is abnormal following a concussion or traumatic brain injury and that concussed individuals tend to have a more conservative gait by lowering their gait velocity and stride length [11][12]. Requirements and constraints were developed in BME 362 and refined in BME 461, seen in Table A1 in Appendix A. These requirements were outlined in a Quality Function Deployment (QFD) chart, seen in Figure A1 in Appendix A and appropriately analyzed to help direct the project. User needs included collecting data, detecting gait cycle anomalies, easy to use, comfortable, compatible with all users, lightweight, and affordable; engineering requirements included portability, accuracy, timely results, cost-accessible technology, and user-friendly for both the athlete and the athletic therapist. These requirements and their associated engineering specifications drove the project forward into concept generation.
The gallery method technique taught in BME 162 was utilized to begin idea generation [13]. This method of brainstorming yielded four ideas: a Smart Kit that would involve sensors integrated into an athlete’s clothing, a device with IMU sensors that the athlete would wear around their chest to help detect gait imbalances, a software application that would allow for the use of memory and reactionary testing, and a computer vision solution that could use machine learning to process a video of a person’s gait. These concepts were compared in a Best of Class chart to the following engineering specifications: portability, outputting results in a timely manner, accurate, cost-accessible, user-friendly for the athlete, and user-friendly for the athletic therapist. The Best of Class chart results yielded that the software application ranked the best, with the other options close in overall score: the chest strap device ranked second, the Smart Kit third, and the computer vision solution fourth. After further literature review and discussion, it was determined that the project would benefit from a combined solution in order to facilitate multimodal testing (also known as dual-task testing) involving the use of the software application combined with another solution, as studies proved that when a patient is asked to multitask (ie. complete a cognitive test while walking), results tend to be more accurate due to a more subconscious gait cycle [14]. The SmartKit was ruled out due to feasibility concerns and the high cost it would incur (multiple IMU, EMG, and heart rate sensors for each athlete), which was an engineering specification taken into consideration. In an effort to prioritize accuracy, the team chose to pursue both the chest strap IMU solution and computer vision options, and after thorough testing, one final option could be selected. After designing began, the IMU solution became a lower body focused solution, with MPU-6050 sensors placed on each of the user’s shanks. A circuit diagram and an image where the IMUs are placed on the subject can be seen in Figure A2 and A3 in Appendix A.
3.1 Motion Capture Study #1
During the design process, adherence to all engineering specifications and requirements was considered, however, the key specifications for accuracy and cost were prioritized due to how critical they were to the success and adoption of the final solution. Hence, a preliminary motion capture study was conducted to assess and compare the accuracy of the proposed solutions. The study utilized the OptiTrack motion capture system and the Lower Body Conventional marker set to compare subjects’ mean gait velocity and stride length measurements over three gait cycles [15]. The experiment results indicated a 29.75% and 25.41% mean errors using the computer vision solution and a 54.71% and 39.17% mean error using the IMU solution for the mean gait velocity and stride length, respectively. Considering the substantial difference in accuracy, alongside the associated costs, set-up time, and the team’s technical expertise, the decision was made to proceed with the computer vision solution. To narrow the large gap between the accuracy of the first iteration of the computer vision solution and the engineering specification requirement, the team conducted further motion capture studies and analysis to test different hypotheses to improve the solution’s accuracy.
3.2 Motion Capture Study #2
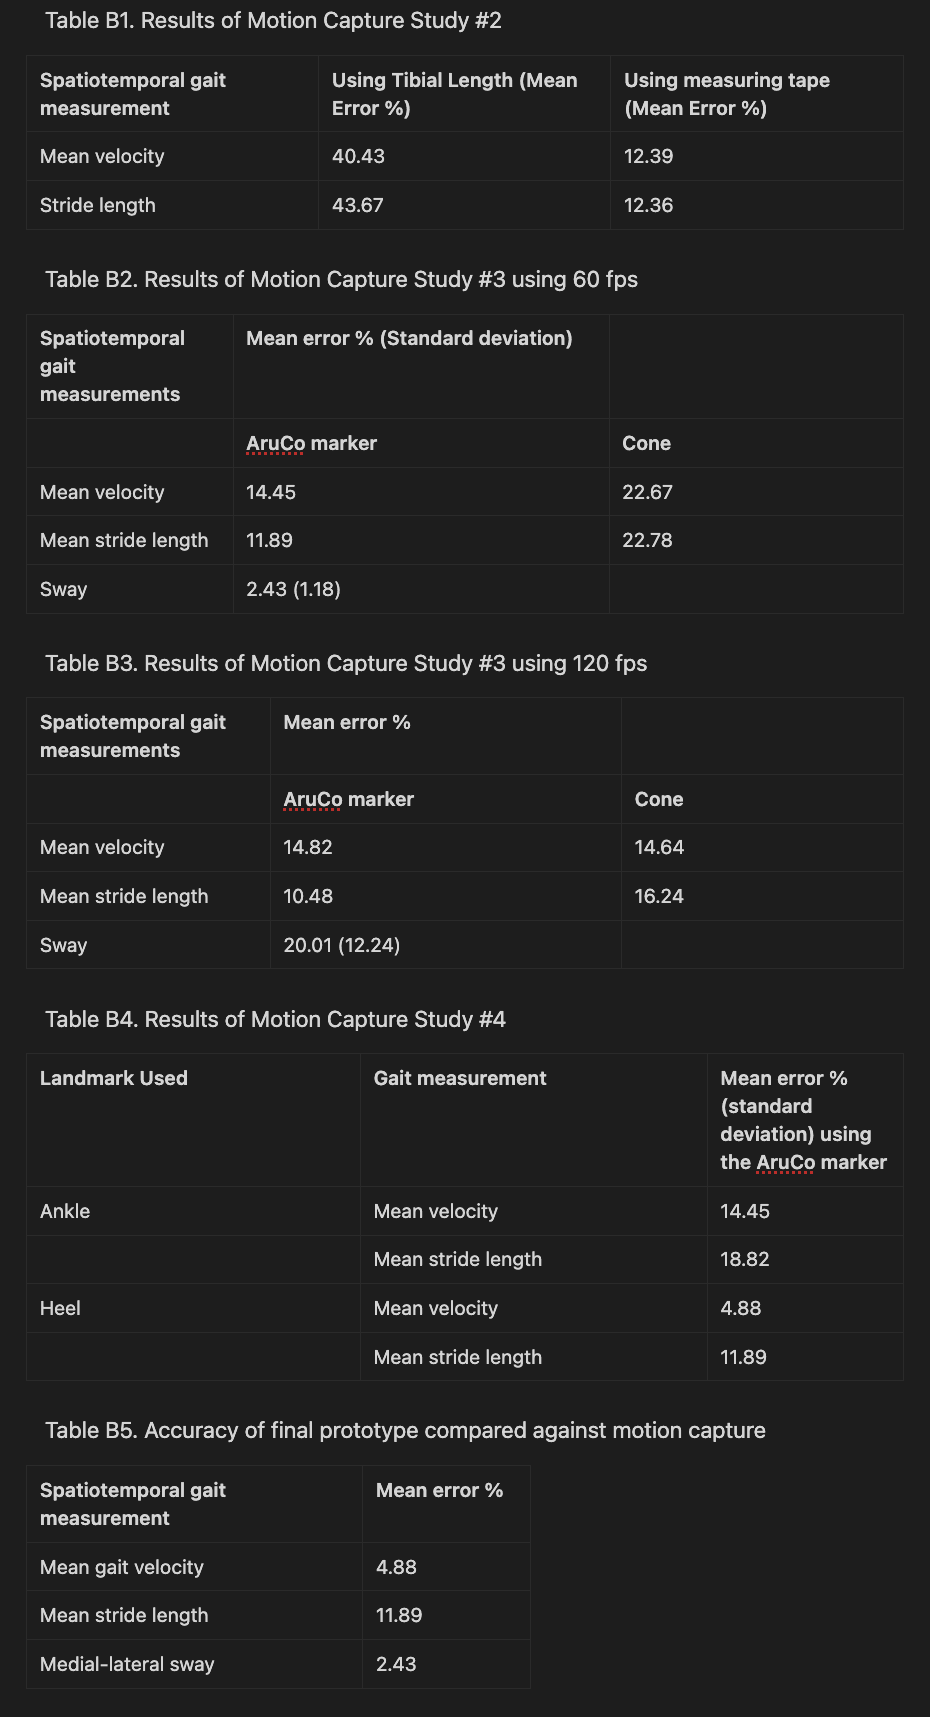
Upon further analysis of the results of the preliminary motion capture study, it was hypothesized that the primary limiting factor of the computer vision solution’s accuracy was the method of scale factor calculation. The first iteration used the subject’s tibial length to derive the scale factor, which is the ratio that maps normalized pixels in video frames to real-life meters. To test the hypothesis, a comparative motion capture study was conducted, comparing the accuracy of the gait velocity and stride length of 3 gait cycles obtained via a measuring tape and the tibial length for scale factor calculation against the motion capture system. The results demonstrated a 28.04% and 31.3% reduction in the mean error of the mean gait velocity and mean stride length, respectively, when using the measuring tape as opposed to the tibial length as seen in Table B1 in Appendix B. Further analysis revealed that the significant improvement in accuracy was due to the discrepancy of the scale factor between the x- and y-directions. Since the tibial length is predominantly aligned with the y-axis, it led to suboptimal results when used to compute the scale factor along the subject’s travel direction along the x-axis. This also highlighted the importance of ensuring that the camera is oriented appropriately using the built-in gyroscope in smartphones. However, due to the impracticality of implementing the measuring tape in the final solution, given the potential poor visibility in an outdoor sports field setting, alternative control objects were explored. These alternative objects included a collapsible traffic cone with a weighted base and an AruCo marker, a binary fiducial marker recognized by the OpenCV model was used.
3.3 Motion Capture Study #3
The two primary objectives for the third motion capture study were 1) to compare the accuracy of all three gait measurements using the cone and the AruCo marker for the scale factor calculation and 2) to compare the accuracy of shooting the video of the subject walking at 60 frames per second (fps) and 120 fps. To do so, the Rizzoli full body marker set was used instead to allow the collection of upper body data for sway calculations [15]. Upon quantitative analysis of three gait cycles which can be seen in Tables B2 and B3 in Appendix B, the AruCo marker scale outperformed the cone in terms of accuracy by 8.22% and 10.89% for the velocity and stride length, respectively, when shooting at 60 fps. The performance of both objects was comparable for both control objects when measuring velocity at 120 fps, but the AruCo marker had a 5.76% reduction in error for stride length at 120 fps when compared to the cone. One of the key findings from this study was that the cone scale factor was not consistent since it depended on the user’s input (choosing the two points that mark the width of the cone’s base) which resulted in different scale factor ratios each time for the same video. Moreover, another key finding is that the cone cannot be used with the front-view camera due to perspective distortion. Since the subject is moving towards the camera, the scale factor changes with each frame, as such, a stationary object such as the cone would not be applicable in this case. In terms of the AruCo marker, the outcomes of the analysis revealed that it is not adequately reliable for calculating the scale factor for sway since the OpenCV model does not reliably detect the marker in each frame. As a result, the team opted to use degrees instead of centimeters to measure sway, thereby, eliminating the need for computing a scale factor for the front-view camera. Upon comparing the accuracy results of the 60 fps and 120 fps for the AruCo marker, it was seen that there were no substantial gains in accuracy between the two for velocity and stride length, whereas, the 120 fps video resulted in an almost 8 times larger mean error as compared to the 60 fps. Furthermore, the 120 fps video took significantly longer processing time than the 60 fps video. All things considered, it was decided that using the AruCo markers and shooting the videos at 60 fps was the optimal solution in terms of accuracy and timeliness of video processing.
3.4 Motion Capture Study #4
Lastly, a final study was conducted to gather more data for calculating the accuracy of the final version of the prototype and to compare using the heel and ankle landmarks to calculate the gait velocity and stride length. After analyzing the gait cycles of the fourth motion capture study, as well as re-analyzing previous gait cycles from prior studies that used the AruCo markers, it was found that using the heel for calculating the gait measurements yielded a 9.57% and 6.93% decrease in error for velocity and stride length measurements as seen in Table B4 in Appendix B. Upon qualitative visual analysis of the model, it was found that the model was able to track the heel landmark more accurately and consistently than the ankle landmark which explains the difference in accuracy between the two landmarks. As a result, after multiple iterations of the computer vision solution, it was decided that using the heel landmark, AruCo marker for scale, and 60 fps for sampling rate yielded the best results that were aligned with the engineering specifications.
3.5 Web Application
The development of the web application followed an agile methodology commonly seen in software development settings. The first step of development was the planning of key user functions and requirements that can be seen in the QFD, in Figure A1 in Appendix A. These functions and requirements were based on the key information acquired through stakeholder interviews. Then a minimum viable product was created, to implement the raw features, and fully implement the backend with all API endpoints. Once confirmation of the MVP meeting the key requirements was met, the implementation of the UI mockups was completed. The final design was decided upon after multiple iterations and feedback cycles. At each step of development, testing was conducted on both the front- and back-end features, with the goal that no changes would break any of the test cases.
4. Social, Economic, and Environmental Impact
The social impacts of implementing a solution for aiding in the process of detection of concussions in post-secondary varsity athletes is important to consider. One significant impact is the enhancement of athlete safety, which helps address the objective of reducing the risk of undetected concussions [16]. The solution allows for the ability to mitigate the long-term physical health and mental health consequences associated with undiagnosed concussions [16]. Furthermore, the deployment of concussion detection solutions helps contribute to public awareness of the risks associated with concussions [17]. This helps foster a deeper understanding of the importance of injury prevention and management strategies within sporting communities at a time when head injuries are highly prevalent in athletes of all ages [17].
Considering the economic impacts, the implementation of this system helps facilitate speedy medical intervention, which helps reduce healthcare costs associated with untreated injuries [18]. This system helps clinics and medical facilities have the ability to better optimize their resource allocation, as well as minimize the financial burden on both the healthcare system and the impacted individuals [18]. Finally, by enabling faster return-to-play decisions, and minimizing the severity of concussions, post-secondary institutions stand to mitigate revenue losses that are commonly attributed to sidelined athletes, thus helping maintain the financial viability of their athletic programs [19].
In terms of the environmental sustainability of the system, it utilizes commonly available technologies, such as smartphones and laptops, that have a relatively negligible effect on energy consumption [20]. Moreover, the design of this system prioritizes sustainability, with the associated components being reusable, and experiencing minimal wear and tear. Furthermore, the OpenCV model used for computer vision is considered to be lightweight which reduces the carbon footprint of running the model [21]. As a result, this system has minimal energy consumption and is also a zero-waste solution.
5. Final Designed Solution
The final version of the designed solution can be seen in Figure A4 in Appendix A. The athletic therapist would follow the following steps to use the computer vision system:
Step 1. Set up the cones around 2-3 m apart, the tripods around 2-3 meters away from the athlete and ensure that the camera is horizontally level using built-in apps such as the iPhone's “measure” app.
Step 2. Attach the AruCo marker close to the athlete’s ankle.
Step 3. Log on to the web application and choose the player the test will be conducted on.
Step 4. Start recording at 60 fps and ask the athlete to walk in between the cones while verbally conducting the Mini-Mental State Exam (MMSE).
Step 5. After the conclusion of the MMSE test, the athlete can rest and the video footage can be uploaded to the web application.
Step 6. The videos will be processed and the athlete’s average gait velocity, stride length, medial-lateral sway, and MMSE score will be output with any deviations highlighted.
5.1 Extracting Spatiotemporal Gait Measurements
OpenCV mediapose, an open-source pose estimation model developed by Google, was utilized to identify and track the key landmarks of the subject’s body. Mediapose was chosen due to its lightweight (reduced computational needs) and better accuracy and consistency in joint tracking compared to other open-source models as found out during the low-fidelity prototyping phase. A Python Flask API was developed to use the model’s output (coordinates of a landmark with respect to the frame size) to extract the spatiotemporal gait measurements.
To extract the mean gait velocity, the right heel is tracked to use the change in the heel’s position between consecutive frames and the video frame rate to compute the athlete’s gait velocity. The output is then passed through a second-order Butterworth low-pass filter with a cutoff frequency of 6 Hz to reduce noise and improve accuracy. To extract the subject’s stride, the coordinates of the right heel are used to extract the velocity in the y-direction using a similar algorithm to the one mentioned previously. The algorithm then arithmetically detects each stride by identifying the key points of zero velocity in the y-direction to pinpoint the frames of the start, mid-, and end of each stride. Using the output of this step, the stride length can be calculated by computing the difference in the position of the right heel at the start frame and end frame of the stride. Lastly, to compute the scale factor, the video footage from the side-view camera is used to detect the distance between two neighboring corners along the x-direction (direction of travel) on the AruCo marker attached to the athlete’s ankle. Since the real-life dimensions of the marker are known, it can be utilized to compute the scale factor ratio. The gait velocity and stride lengths are then averaged over time and the number of strides, respectively, and multiplied by the scale factor to output the measurements in meters.
To extract sway, the coordinates of the hip midpoint (point A), shoulder midpoint (point B), and a reference point (C) (located on the x-position of the hip midpoint and y-position of the shoulder midpoint) are extracted for each frame as depicted in Figure A5 in Appendix C. The angle CAB is then computed and averaged to get the mean sway angle across the gait cycle. It is important to note that this method of detecting sway works for upper-body sway, rather than full-body sway. This decision was made since athletic therapists are trained to identify full-body medial-lateral sway through walking tests, however, identifying subtle sway in the upper body is a much more challenging task to do with the naked eye [1].
5.2 Web Application
The web application was composed of a React front-end, a Node.js backend, and a MySQL database setup. To make API requests to the database, Express.js was utilized and to make the API requests to retrieve the gait data from the computer vision module, Flask was used.
In order to thoroughly develop the software application, it was necessary to make mockups of the potential interfaces that a user would interact with. Thus, UX/UI research was conducted in order to develop prototypes. Figure 1 displays some of the developed interfaces that the app utilized. Multiple designs were considered and it was only after thorough consultation and usability evaluations that the final design was implemented; this testing will be discussed in detail in Design Evaluation & Validation. Engineering specifications revolving around usability were taken into consideration, and adequate verification was performed to ensure the application was user-friendly.
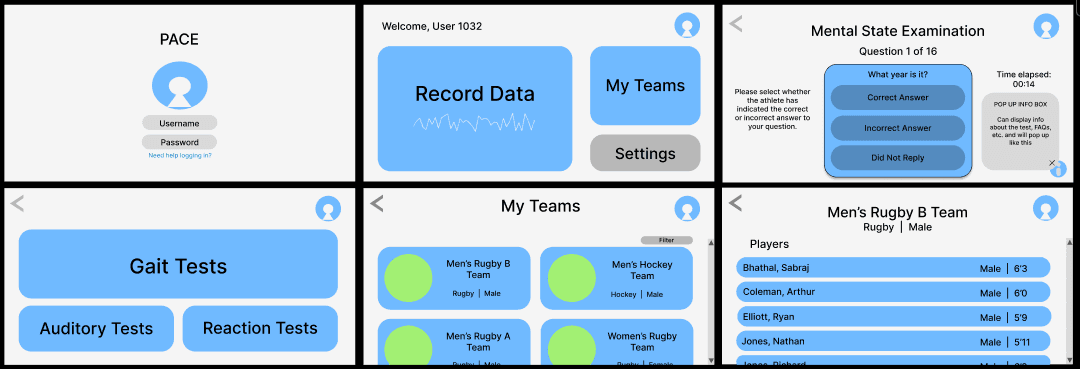
Figure 1. Figma Final Interface Designs to Guide App Development
The final solution differed slightly from the mockups, as the authentication system was scrapped, and instead replaced with local deployment, and small design changes were also made. The final UI screens of the application can be seen in Figures A6-A11 in Appendix A.
6. Design Evaluation and Validation
Rigorous testing was conducted to ensure that the device met the developed engineering specifications. Testing was completed in an iterative process, with time for feedback to allow further testing to be completed. It was important to outline each engineering specification separately and determine if the testing completed for this requirement satisfied the specification or not. Outlined below are the various requirements and the validation/verification that was performed to evaluate the specification.
6.1 Requirement 1: Must Be Portable (< 12” x 8” x 11”)
The physical setup for the system comprises the following components, with the associated dimensions:
Two tripods: 2x: 12.99" x 15.71" x 15.71" [22]
Two cones: 2x: 9.84" x 9.84" x 1.18" [23]
One laptop: 1x: 11" x 9" x 0.7" [24]
The overall size of the setup is determined to be 15.71" x 15.71" x 15.71". Consequently, it is evident that the initial requirement of fitting the entire setup into a medical bag is not met.
Nevertheless, considering the specific scenarios in which the system will be deployed, it is deemed appropriate to revisit and refine the set requirement to better align with the practicalities of the system usage. This adaptability ensures that the system remains well-suited for its intended applications, thereby optimizing its functionality and usability in real-world contexts.
6.2 Requirement 2: Must Output Results in a Timely Manner (< 10 MINUTES)
The extensive profiling analysis conducted on the full system yielded insightful results, which are summarized as follows. These results are for 15 full runs and are averages.
Creating a team / Adding a player: 17.43 seconds
Conducting the MMSE examination and gait test: 106.95 seconds
Transferring videos from phone to laptop: 212.39 seconds
Uploading videos: 64.16 seconds
Viewing data: 15.33 seconds
Overall, the average time required to complete the entire system operation was found to be 445.26 seconds, equivalent to approximately 6.94 minutes.
These findings are in accordance with the stipulated requirement of conducting the tests and delivering results within a timeframe of less than 10 minutes, thus demonstrating the efficiency and effectiveness of the system in meeting the objectives.
6.3 Requirement 3: Must Be Accurate (<8% Mean Absolute Error)
The accuracy results of the final version of the solution as measured against the OptiTrack motion capture system which can be seen in Table B5 was achieved through an iterative design process and multiple motion capture experiments as discussed in previous sections. The engineering specification for this requirement was a mean error of less than 8% which is met by the gait velocity and medial-lateral sway measurements which had an error of 4.88% and 2.43%, respectively. However, stride length did not meet the engineering specification since its mean error was 11.89%.
Furthermore, to validate the solution in a realistic scenario, the final prototype was tested using three subjects of varying heights, sex, and skin color under different conditions (outdoors in the morning, outdoors at night, and indoors). The output of the solution was then sanity-checked by comparing the output with the estimated expected velocity and stride length. Lastly, sway was checked by ensuring that the model outputs increased sway in gait cycles with exaggerated medial-lateral sway. All things considered, it is safe to say that the accuracy requirement and specification have been met for gait velocity and sway but not for stride length. To improve stride length accuracy, a more robust algorithm for stride detection would need to be developed.
6.4 Requirement 4: Must Use Cost-accessible Technologies (<$600 Per Unit)
In accordance with the physical setup stated in requirement 1, the prices for the components are as follows:
Tripods: 2x: $36.99 [22]
Cones: 2x: $26.99 [23]
Laptop: The laptop is a resource readily available to athletic therapists.
Smartphones: The smartphones are a resource readily available to athletic therapists.
The overall price of the setup is calculated to be $127.96. Consequently, it is evident that the requirement set regarding affordability is met. Furthermore, it is worth noting that cheaper instances of both these items can be sourced, and when purchased in wholesale quantities, the overall price is expected to decrease. This flexibility in purchase options enhances the cost-effectiveness of the system, making it more accessible for deployment in various settings.
6.5 Requirement 5: Must Be User-friendly for the Athletic Therapist (>= ⅗ On Likert Scale)
Two of the developed engineering specifications revolved around the usability of the device: the user-friendliness for the athlete and the user-friendliness for the athletic therapist. Since the therapist would primarily be interacting with the software application, the user interface was assessed by constructing a usability evaluation form and gathering feedback. First iterations of the usability testing involved conducting tests with a wide variety of users (peers, colleagues, etc.) in order to receive a multitude of opinions. It was imperative that users of various technological backgrounds were tested, since the technological expertise of the therapist will vary. Simplicity and ease of use were the priorities of the interface; thus, users were consulted about various options and asked to select which they preferred based on those metrics. Space was provided in the usability forms for the user to provide feedback as desired. Some of the original home screen designs (featuring a variety of button placements and a possible dropdown menu) are shown in Figure 2.

Figure 2. Possible Designs of the Software Application Home Screen.
The usability survey received twenty-one responses. Users were asked to rate their familiarity with technology; responses ranged from 2 to 5 out of 5 with an average score of 4. In the survey, users were asked to compare the dropdown menu to a screen of only three buttons. Both ranked similarly: 47.6% of users thought the buttons-only screen would be the easiest to use while 33.3% selected the dropdown menu screen (19% were indifferent). Both ranked identically in user confidence in their ability to run a gait test (100% of users agreed they would be able to). Thus, in an effort to prioritize simplicity (both for the interface itself and the ongoing development of it by the team), the buttons-only option was chosen. Users were asked about their preference for the profile and welcome message along the top or bottom; 90.5% of users preferred it along the top. Users were asked about their layout preference for the button selection and whether they preferred the largest button on the left or right (shown in Figure 2); 47.6% of users preferred the large button on the left compared to 38.1% preferring it on the left (with 14.3% being indifferent).
Additionally, users were consulted about color choices and which options appealed to them most; some examples presented to them included colored backgrounds, white backgrounds, darker button colors, and lighter button colors (these examples are included in Figure A12 in Appendix A). 42.9% of users preferred white backgrounds compared to 28.6% preferring colored backgrounds (28.6% indifferent); 47.6% of users preferred light color tones compared to 33.3% preferring solid tones (19% indifferent). When asked to select their preferred color schemes (with the ability to choose as many as they wished), the light blue and white theme was the most favorable; these results can be seen in Figure 3.
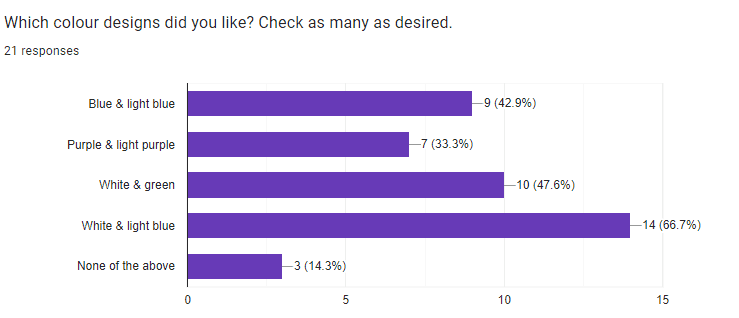
Figure 3. Color Preference Results of the Usability Evaluations.
With this information, a finalized version of the software application interface could be developed (as shown in Figure 1). In order to ensure the engineering specification of user-friendliness for the athletic therapist was met, the team consulted an athletic therapist at the university for feedback. The athletic therapist enjoyed the finalized product and agreed that this would be useful in his profession, as well as provided valuable feedback and insight into the potential of this project and what future development could yield. Therefore, the product meets the engineering specification of being user-friendly to the athletic therapist.
6.6 Requirement 6: Must Be User-friendly for the Student-athlete (>= ⅗ On Likert Scale)
To assess the user-friendliness for the user, a brief survey form was created and provided to users who volunteered to try out the product. The survey was optional and all data was kept strictly anonymous. In line with the threshold established in the QFD, the user was provided with two questions that required an answer from a Likert scale; the user was asked to rate their comfort when completing the demo and their overall experience. This survey yielded nine responses, the results of which are shown in Figure 4.
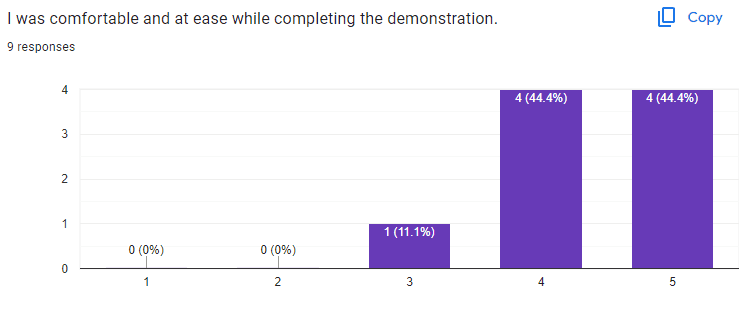
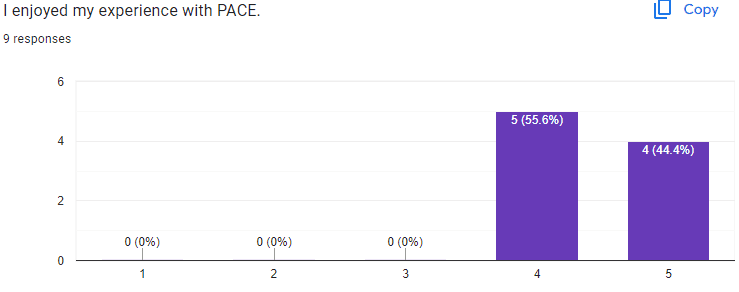
Figure 4. Results of User Testing.
The demonstration received excellent results. On average, users rated PACE a 4.3 out of 5 on comfort and ease of use, and rated their overall experience a 4.4 out of 5. Since the target threshold established in the QFD was 4 out of 5, this successfully meets the engineering specification for user-friendliness for the athlete.
7. Design Safety and Regulations
It is imperative to underscore the paramount importance of ensuring the well-being of athletes and compliance with pertinent regulations. The concussion detection system falls within the classification of Class II medical devices [25]. Despite not being designed for diagnosing concussions, it serves as a valuable tool for providing data and anomaly detection to aid athletic therapists in their assessments [25]. This has been clearly communicated to the end users to help ensure proper understanding and utilization of the device within its intended scope.
In accordance with the Personal Information Protection and Electronic Documents Act (PIPEDA), the system adheres to stringent protocols for handling sensitive personal data obtained from cognitive tests and video recordings [26]. Robust measures are implemented to ensure the appropriate handling, storage, and protection of this information, always safeguarding individual privacy and confidentiality [26]. These measures include the deletion of data after three full years have passed. If the athletic therapist leaves the post-secondary institution, the data can be transferred to the athletic therapist that is now looking over the specific team. Safety considerations extend beyond data protection as they also include the physical setup of the system. Precautions have been implemented to mitigate risks and ensure the well-being of athletes during testing procedures. The positioning of tripods at a safe distance from athletes' walking paths minimizes the potential for interference or accidents. Furthermore, the placed cones signify the designated walking area, enhancing overall safety and clarity of movement within the testing environment. By prioritizing safety and regulatory compliance, the concussion detection system exemplifies an unwavering commitment to upholding the highest standards of ethical practice and user safety.
8. Limitations of Designed Solution
Acknowledging the importance of continuous improvement and iteration, it is crucial to recognize the existing limitations within the concussion detection system.
The current process for uploading videos within the system is acknowledged as being inefficient. Presently, video recordings are captured using a phone and subsequently uploaded to Google Drive. However, this method necessitates an extra step where the videos must be downloaded onto the laptop for further processing. Such a multi-step process consumes valuable time, which could otherwise be decreased to better the user experience.
Furthermore, the limitations imposed by physical space constraints in the motion capture tests present notable challenges to the testing functionality. The system's capacity to capture video recordings is constrained by the available physical space, thereby restricting the number of gait cycles that can be tested simultaneously. This limitation impedes the system's ability to scale effectively and test perfectly parallel to the actual gait test where the athlete walks continuously between two cones. Additionally, the placement of the tripods and cameras is constrained by the physical boundaries of the testing environment, limiting the perspective of the video recordings.
Lastly, as seen in the breakdown of requirement 2, a large portion of the total time is due to the processing time to get the final output from the model which can be improved through changes to the algorithm and model computation.
9. Conclusions and Recommendations
In conclusion, the project successfully met the developed engineering specifications and provided accurate objective data that could be delivered to an athletic therapist for use in a more confident diagnosis. The final product proved to be accurate for gait velocity and medial-lateral sway when compared to motion capture technology, was cost-effective, and verified to be both user-friendly for the athlete and the athlete therapist through usability evaluations. The culmination of research, development, and testing over the past three semesters has led to mostly successful outcomes; engineering analysis tools, technological development, rigorous testing, and a plethora of hard work have contributed heavily to this success.
While successful, there is still much room for potential project growth, which speaks to the scalability and potential of this product. To overcome some of the aforementioned limitations, it is recommended that further testing be conducted using a larger motion capture system to allow for the assessment of more natural, consecutive gait cycles and for a more robust algorithm to detect each stride for stride length calculations. Moreover, more robust validation trials can be conducted in varying weather conditions to account for all circumstances the solution may be used. In terms of improving the processing time, GPU cloud computing services can be leveraged to improve the model’s runtime. Finally, to address the process of uploading videos, a phone application where the athletic therapist can scan a QR code displayed after the MMSE would allow the therapist to upload the video for computation directly, and minimize data transfer time.
Acknowledgments
The team would like to thank Professor George Shaker and Professor Bryan Tripp of the University of Waterloo for their continued guidance and feedback throughout the course of the semester. Furthermore, the team would like to thank Calvin Young, without whom motion capture testing would be difficult and would have hindered the progress of this project, and professor / athletic therapist Robert Burns, for excellent feedback and valuable insight into the future of the project.
References
[1] L. Parent, S. Bhathal, and M. Gad, “Concussions in Varsity Athletes” in-person Meeting (November 9, 2022).
[2] “A Neurosurgeon’s Guide to Sports-related Head Injury,” Aans.org, 2022. [Online]. https://www.aans.org/Patients/Neurosurgical-Conditions-and-Treatments/Sports-related-Head-Injury [Accessed Mar. 26, 2024].
[3] K. Glendon, G. Blenkinsop, A. Belli, and M. Pain, “Does Vestibular-OcularMotor (VOM) Impairment Affect Time to Return to Play, Symptom Severity, Neurocognition and Academic Ability in Student-Athletes Following Acute Concussion?”, Brain Injury, 2021; 35:7, 788–797, doi: 10.1080/02699052.2021.1911001
[4] A. L. Zhang, D. C. Sing, C. M. Rugg, B. T. Feeley, and C. Senter, “The Rise of Concussions in the Adolescent Population,” Orthopaedic Journal of Sports Medicine, vol. 4, no. 8, p. 232596711666245, Aug. 2016, doi: 10.1177/2325967116662458.
[5] T. Bey, and B. Ostick, “Second impact syndrome,” The Western Journal of Emergency Medicine, vol. 10, no. 1, pp. 6–10, 2009, PMID: 19561758; PMCID: PMC2672291.
[6] “Sport concussion assessment tool - 5th edition,” British Journal of Sports Medicine, p. bjsports-2017-097506SCAT5, Apr. 2017, doi: 10.1136/bjsports-2017-097506scat5.
[7] F. N. Conway et al., “Concussion Symptom Underreporting Among Incoming National Collegiate Athletic Association Division I College Athletes,” Clinical Journal of Sport Medicine, vol. Publish Ahead of Print, Jan. 2018, doi: 10.1097/jsm.0000000000000557
[8] Neurolytixs Inc, “Canadian-made concussion diagnostic tool by Neurolytixs Inc. secures US patent to address a worldwide health challenge,” Newswire.ca, Aug. 30, 2022.
[9] BrainScope Company, Inc. “Brainscope Homepage,” Brainscope.com, 2022. https://www.brainscope.com/ [Accessed Mar. 29, 2024].
[10] D. Hanley, L.S. Prichep, N. Badjatia, J. Bazarian, R. Chiacchierini, K.C. Curley, J. Garrett, E. Jones, R. Naunheim, B. O’Neil, J. O’Neil, D.W. Wright, and J.S. Huff, “A Brain Electrical Activity Electroencephalographic-Based Biomarker of Functional Impairment in Traumatic Brain Injury: A Multi-Site Validation Trial,” Journal of Neurotrauma, vol. 35, no. 1, pp. 41–47, Jan. 2018, doi: 10.1089/neu.2017.5004.
[11] P.C. Fino, L. Parrington, W. Pitt, D.N. Martini, J.C. Chesnutt, L. Chou, and L.A. King, “Detecting gait abnormalities after concussion or mild traumatic brain injury: A systematic review of single-task, dual-task, and complex gait,” Gait & Posture, vol. 62, pp 157–166, May 2018, doi: 10.1016/j.gaitpost.2018.03.021.
[12] R.D. Catena, P. van Donkelaar, L. Chou, “Altered balance control following concussion is better detected with an attention test during gait,” Gait & Posture, vol. 25, no. 3, 406–411, 2007, https://doi.org/10.1016/j.gaitpost.2006.05.006.
[13] C. L. Dym, Engineering Design. John Wiley & Sons, 2013. Accessed: Mar. 29, 2024. [Online]. Available: https://www.wiley.com/en-us/Engineering+Design:+A+Project+Based+Introduction,+4th+Edition-p-9781118324585
[14] D.R. Howell, S. Bonnette, J.A. Diekfuss, D.R. Grooms, G.D. Myer, J.C. Wilson, and W.P. Meehan, “Dual-Task Gait Stability after Concussion and Subsequent Injury: An Exploratory Investigation,” Sensors (Basel), vol. 20, no. 21, Nov 5 2020, doi: 10.3390/s20216297.
[15] OptiTrack, “SKELETON MARKER SETS | v3.1 | EXTERNAL OptiTrack Documentation,” Optitrack.com, Nov. 20, 2023. https://docs.optitrack.com/markersets [Accessed Apr. 04, 2024].
[16] Massive Media Inc and R. Babcock, “Psychological & Social Impacts of Sports Concussion in Youth | HEADCHECK HEALTH,” HEADCHECK HEALTH, Jul. 03, 2019. https://www.headcheckhealth.com/psychological-social-impacts-sports-concussion-youth/ [Accessed Dec. 08, 2022].
[17] B. L. Quick, E. M. Glowacki, L. A. Kriss, and D. E. Hartman, “Raising Concussion Awareness among Amateur Athletes: An Examination of the Centers for Disease Control and Prevention’s (CDC)Heads UpCampaign,” Health Communication, vol. 38, no. 2, pp. 298–309, Jul. 2021, doi: https://doi.org/10.1080/10410236.2021.1950295.
[18] Faraz Damji and Shelina Babul, “Improving and standardizing concussion education and care: a Canadian experience,” Concussion, vol. 3, no. 4, pp. CNC58–CNC58, Dec. 2018, doi: https://doi.org/10.2217/cnc-2018-0007.
[19] C. M. Baugh, W. P. Meehan, T. G. McGuire, and L. A. Hatfield, “Staffing, Financial, and Administrative Oversight Models and Rates of Injury in Collegiate Athletes,” Journal of Athletic Training, vol. 55, no. 6, pp. 580–586, Apr. 2020, doi: https://doi.org/10.4085/1062-6050-0517.19.
[20] T. Ullah, Ameer Hamza Siraj, Umer Mukhtar Andrabi, and A. Nazarov, “Approximating and Predicting Energy Consumption of Portable Devices,” 2022 VIII International Conference on Information Technology and Nanotechnology (ITNT), May 2022, doi: https://doi.org/10.1109/itnt55410.2022.9848659.
[21] MediaPipe, “Pose landmark detection guide,” Google for Developers, 2024. https://developers.google.com/mediapipe/solutions/vision/pose_landmarker [Accessed Apr. 04, 2024].
[22] Amazon CA, “Kaiess 62" iPhone Tripod, Selfie Stick Tripod & Phone Tripod Stand with Remote, Cell Phone Tripod for iPhone, Extendable Travel Tripod Compatible with iPhone 14/13/12 Pro Max/Android/GoPro : Amazon.ca: Electronics,” Amazon.ca, 2024. https://www.amazon.ca/dp/B09X1K5WW9?starsLeft=1&ref_=cm_sw_r_cso_cp_apin_dp_VDEAD3CE7X12A6RXKFQS&th=1 [Accessed Apr. 05, 2024].
[23] Amazon CA, “Safety Cone with Weighted Base 18 Inch-1 Pack Collapsible Traffic Cone Pop Up Reflective Construction Cones with 2 High-Intensity Grade Reflective Stripes (1, 18 Inch with Weighted Base) : Amazon.ca: Tools & Home Improvement,” Amazon.ca, 2024. https://www.amazon.ca/dp/B0CGWR45QR?starsLeft=1&ref_=cm_sw_r_cso_cp_apin_dp_TYMDW086SZ40W0AZPJYG&th=1 [Accessed Apr. 05, 2024].
[24] Microsoft, “How to Choose the Best Laptop Screen Size – Microsoft Surface,” Surface, 2023. https://www.microsoft.com/en-us/surface/do-more-with-surface/how-to-choose-the-best-laptop-screen-size#:~:text=Standard laptop screen sizes range, common size on the market. [Accessed Apr. 05, 2024].
[25] H. Canada, “Guidance Document - Guidance on the Risk-based Classification System for Non-In Vitro Diagnostic Devices (non-IVDDs) - Canada.ca,” Canada.ca, 2015. https://www.canada.ca/en/health-canada/services/drugs-health-products/medical-devices/application-information/guidance-documents/guidance-document-guidance-risk-based-classification-system-non-vitro-diagnostic.html?fbclid=IwAR05eCXeRUWHxX7osvZ6ZuoevhH_fKlpX3SZ3FPz7HX2fXM2AuQDzesuat8 [Accessed Dec. 03, 2023].
[26] Legislative Services Branch, “Personal Information Protection and Electronic Documents Act,” Justice.gc.ca, 2024. https://laws-lois.justice.gc.ca/eng/acts/P-8.6/index.html [Accessed Apr. 05, 2024].
Appendices
APPENDIX A
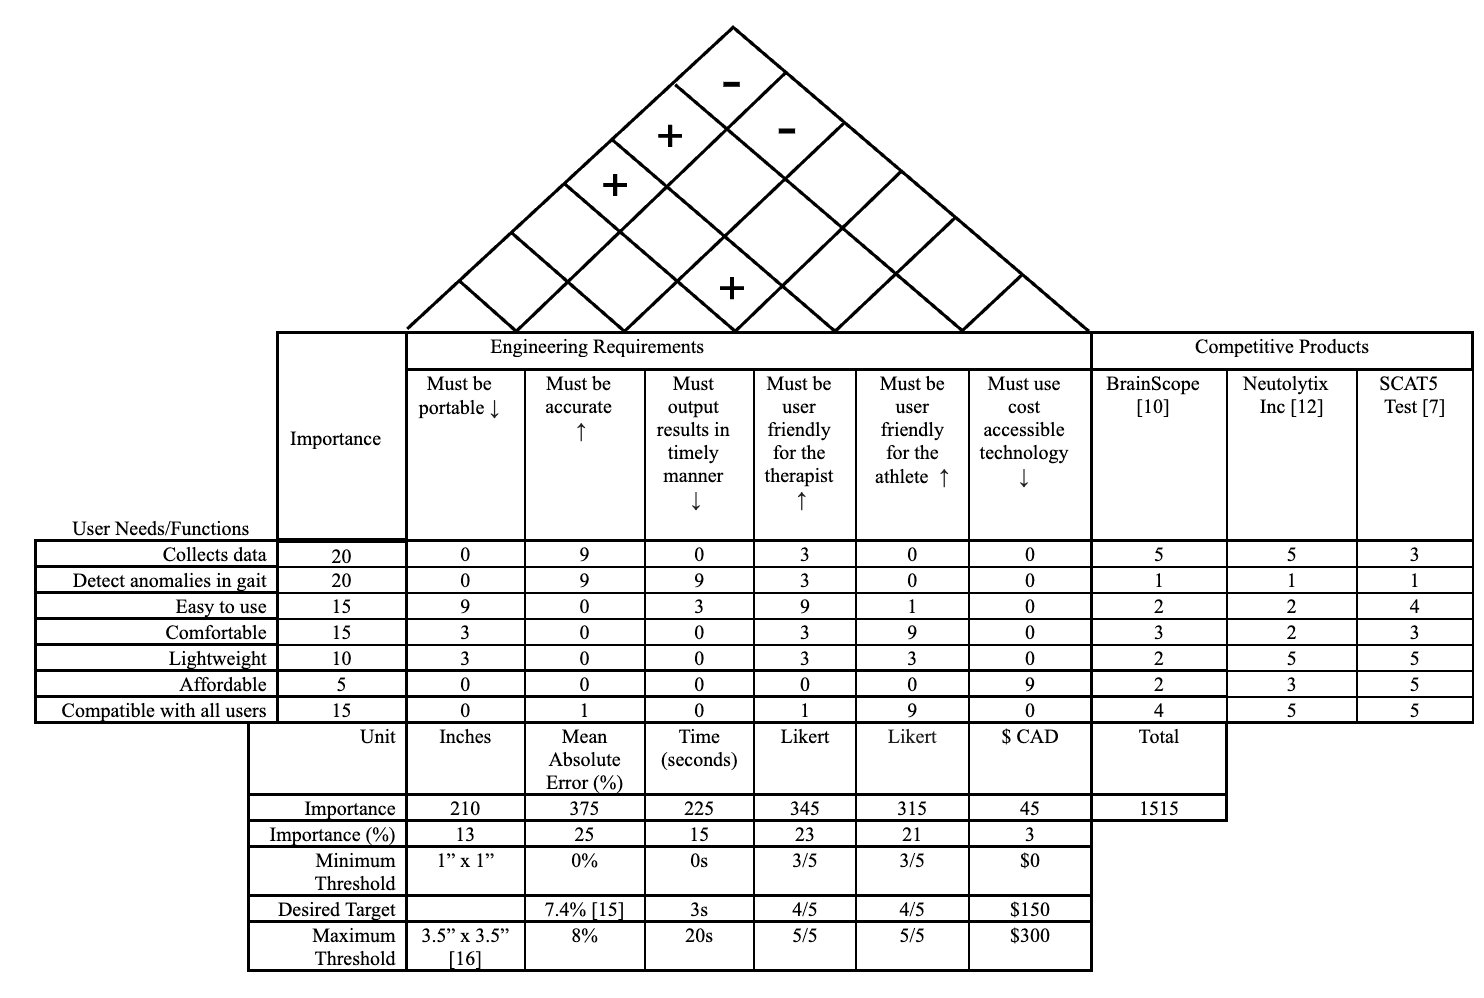
Figure A1. Quality Function Deployment Chart
Table A1. Requirements and Engineering Specifications Table
APPENDIX B
